Report LaTeX Template with Cover Page
A free LaTeX report template with a cover page, executive summary and numbered sections, easy to scan from the first page to the last.
LaTeX source
% Report template: cover page, executive summary, table of contents, numbered sections with a table and a chart,
% recommendations, references and an appendix, in the KOMA-Script scrartcl class. It is filled with an example
% (energy review of an office building; the figures are illustrative) so you can see how each part works.
% Replace the example text, the table and the chart data with your own.
\documentclass[a4paper,11pt,headings=small]{scrartcl}

\usepackage[T1]{fontenc}
\usepackage{lmodern}
\usepackage[english]{babel}
\usepackage[margin=2.5cm]{geometry}
\usepackage{microtype}
\usepackage{xcolor}
\usepackage{booktabs}
\usepackage{siunitx}
\usepackage{tabularx}
\usepackage{graphicx}  % only needed if you include image files with \includegraphics
\usepackage{pgfplots}
\usetikzlibrary{babel}
\usepackage{scrlayer-scrpage}
\usepackage[hidelinks]{hyperref}

\pgfplotsset{compat=1.18}

% Accent colour of the headings and the cover: change it here
\definecolor{accent}{HTML}{1F4E79}
\addtokomafont{section}{\color{accent}}
\addtokomafont{subsection}{\color{accent}}

% ---- Report details: edit these ----
\newcommand{\reporttitle}{Energy Use Review}
\newcommand{\reportsubtitle}{Headquarters Office Building, 2025}
\newcommand{\reportauthor}{Alex Morgan}
\newcommand{\reportorganisation}{Example Consulting Ltd.}
\newcommand{\reportclient}{Prepared for: Sample Properties Inc.}
\newcommand{\reportversion}{Version 1.0}

% Running header and footer
\pagestyle{scrheadings}
\ihead{\reporttitle}
\ohead{\reportversion}
\cfoot{\pagemark}

\begin{document}

% ---- Cover page ----
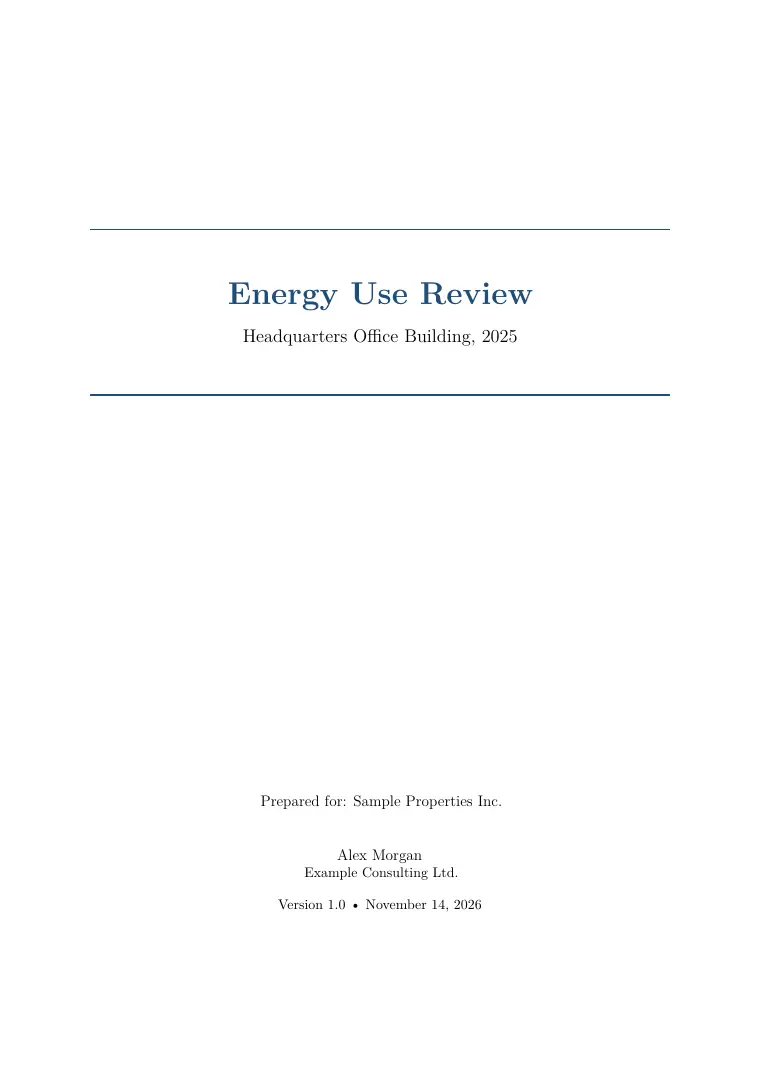
\begin{titlepage}
  \centering
  \vspace*{3cm}
  {\color{accent}\rule{\textwidth}{1.2pt}}\par\vspace{1cm}
  {\Huge\bfseries\color{accent}\reporttitle\par}
  \vspace{0.4cm}
  {\Large\reportsubtitle\par}
  \vspace{1cm}
  {\color{accent}\rule{\textwidth}{1.2pt}}\par
  \vfill
  {\large\reportclient\par}
  \vspace{1cm}
  {\large\reportauthor\par}
  {\reportorganisation\par}
  \vspace{0.4cm}
  {\reportversion\ \textbullet\ \today\par}
  \vspace*{2cm}
\end{titlepage}

\section*{Executive summary}
% Write it last: the objective, the main findings and the decisions you ask for, in half a page.
The headquarters building used \qty{1.24}{GWh} of electricity in 2025. Heating, ventilation and air
conditioning account for \qty{46}{\percent} of the total, lighting for \qty{21}{\percent} and office equipment
for \qty{19}{\percent}. Consumption peaks in July and January, and \qty{31}{\percent} of the energy is used
outside working hours. We recommend three measures that together could save about \qty{18}{\percent} of
the annual consumption, with a payback below four years.

\tableofcontents
\clearpage

\section{Introduction}
% State the purpose, the scope and the sources of data of the report.
This report reviews the energy use of the headquarters building of Sample Properties Inc.\ during 2025 and
proposes measures to reduce it. It covers electricity only; gas and water are outside its scope. The data come
from the building's smart meters, read every 15 minutes, and from the maintenance logs \cite{iea2021}.

\section{Findings}
\subsection{Consumption by use}
Table~\ref{tab:use} shows how the annual consumption splits by use. Heating, ventilation and air
conditioning (HVAC) dominate, followed by lighting and office equipment.

\begin{table}[!ht]
  \centering
  \caption{Annual electricity consumption by use, 2025 (illustrative figures).}
  \label{tab:use}
  \begin{tabularx}{0.85\linewidth}{Xrr}
    \toprule
    Use & Energy (MWh) & Share (\%) \\
    \midrule
    HVAC & 570 & 46 \\
    Lighting & 260 & 21 \\
    Office equipment & 236 & 19 \\
    Other & 174 & 14 \\
    \midrule
    Total & 1240 & 100 \\
    \bottomrule
  \end{tabularx}
\end{table}

\subsection{Monthly profile}
Figure~\ref{fig:monthly} shows the monthly consumption. The summer peak comes from cooling and the winter peak
from heating, and the lowest consumption is in April.

\begin{figure}[htbp]
  \centering
  % The chart is drawn with pgfplots, so no image file is needed. To use an image instead:
  % \includegraphics[width=0.8\linewidth]{chart.png}
  \begin{tikzpicture}
    \begin{axis}[
      ybar, width=0.9\linewidth, height=6cm, bar width=9pt,
      ylabel={Energy (MWh)}, ymin=0, ymax=140,
      symbolic x coords={Jan,Feb,Mar,Apr,May,Jun,Jul,Aug,Sep,Oct,Nov,Dec},
      xtick=data, enlarge x limits=0.06, ymajorgrids,
    ]
      \addplot[fill=accent, draw=none] coordinates {
        (Jan,118) (Feb,108) (Mar,98) (Apr,92) (May,96) (Jun,112)
        (Jul,128) (Aug,104) (Sep,100) (Oct,94) (Nov,96) (Dec,94)
      };
    \end{axis}
  \end{tikzpicture}
  \caption{Monthly electricity consumption, 2025 (illustrative figures).}
  \label{fig:monthly}
\end{figure}

\section{Recommendations}
Table~\ref{tab:measures} lists the measures in order of priority, with the estimated saving and the payback
period.

\begin{table}[!ht]
  \centering
  \caption{Recommended measures (illustrative estimates).}
  \label{tab:measures}
  \begin{tabularx}{\linewidth}{lXrr}
    \toprule
    Priority & Measure & Saving (\%) & Payback (years) \\
    \midrule
    1 & Replace fluorescent lamps with LED and add presence sensors & 8 & 2.5 \\
    2 & Schedule HVAC to the occupancy of the building & 6 & 1.0 \\
    3 & Switch off office equipment automatically at night & 4 & 3.5 \\
    \bottomrule
  \end{tabularx}
\end{table}

\section{Conclusions}
% Summarise the answer to the objective and the next steps, with owners and dates if possible.
Most of the saving potential lies in lighting and in running the HVAC system only when the building is used.
We suggest starting with measure~2, which has the shortest payback, and reviewing the results after six
months of metering.

\begin{thebibliography}{9}
  % Add your sources here and cite them with \cite{key}
  \bibitem{iea2021} International Energy Agency. \emph{Energy Efficiency 2021}. IEA, Paris, 2021.
\end{thebibliography}

\appendix
\section{Method of data collection}
The meters record active power every 15 minutes. The values were summed by hour, day and month. Missing readings (less than
\qty{0.5}{\percent} of the total) were replaced by the mean of the neighbouring intervals.

\end{document}